Why you need a dedicated tool for data exploration?
SenseTable transforms data exploration from a series of tedious chores into a smooth, intuitive workflow.
Data exploration: the hidden engine of ML
Data exploration is omnipresent in Machine Learning lifecycle --— a continuous, essential activity that happens at every stage of your ML project. While often overlooked, it's the foundation that makes everything else possible:
- Data Collection: Quickly validate raw data quality and spot garbage entries.
- Feature engineering: identify outliers, missing values, correlations and bias.
- Dataset curation: Navigate subsets to balance classes or prune noisy data.
- Training & evaluation: Inspect failure patterns and dive into specific examples.
- Deployment monitoring: Detect real-world data drift and anomalies.
This cycle never truly stops. It’s not a single kickoff task — it’s the connective tissue of the ML development loop. Without strong exploration capabilities, you’re left with vague suspicions instead of concrete, testable hypotheses.
Analytics vs Exploration
| Aspect | Analytics | Exploration |
|---|---|---|
| Goal | Clear and predefined: "Compute KPI metrics" | Ambiguous and evolving: "Is my dataset good, balanced, or sufficient?" |
| Workflow | Linear: question → query → answer | Branching: one discovery triggers 3–5 more questions → and more after that |
| Scope | Summarizing known metrics | Probing unknowns: anomalies, corner cases, unusual distributions |
| Granularity | Aggregates and trends | Shifting between macro-level stats and micro-level samples |
| Tools | Dashboards, BI tools, SQL queries | Multi-modal viewers, annotation tools, embedding visualizers, ad-hoc scripts |
The pain points
Many data analytics tools are user-friendly and productive, but they often lack the flexibility needed for true data exploration. When exploring, you frequently end up writing ad-hoc scripts and performing tedious manual steps.
Exploration is about answering a constant stream of small evolving questions. Each script may only take a few minutes to write, but the interruptions pile up. They break your flow state, drain your energy, and slow down the progress.
How SenseTable helps
SenseTable automates 80% of repetitive exploration work, while making it easy to plug in your own scripts for the rest.
It works directly with popular data formats — CSV, Parquet, JSONL, Lance — whether they live on your laptop, in S3, or in other cloud storage.
Feature highlights
❤️ A GUi carefully designed for data professionals
- IDE-style panels — rearrange, maximize, close, and resize at will
- Light and dark modes — reduce eye strain
- Clean information architecture — details are always one click away
😀 Automated common operations in your daily work:
- Quick file previews — open CSV, Parquet, YAML, JSON without downloading from S3
- Smart folder navigation - peek into subfolders without opening them one by one
- Instant column insights — visualize distributions with zero setup
- Interactive slice-n-dice - search, sort, and filter with real-time visual updates
- Drill-through — jump from high-level plots to specific samples
- Native media support — images, videos, and domain-specific visualizations
- Cross analysis — view relationships between two columns and explore related samples
- Shareable context — capture and share your current exploration state with a link
📈 Scale to billions of rows and hundreds of columns
- Column customization - search/rearrange/hide columns to focus on what matters to you.
- Efficient large file handling - inspect 10GB parquet, 500MB+ JSON or CSV files without freezing your laptop
- Visualization and sampling - specially designed plots and sampling works on billion level data points.
How it works
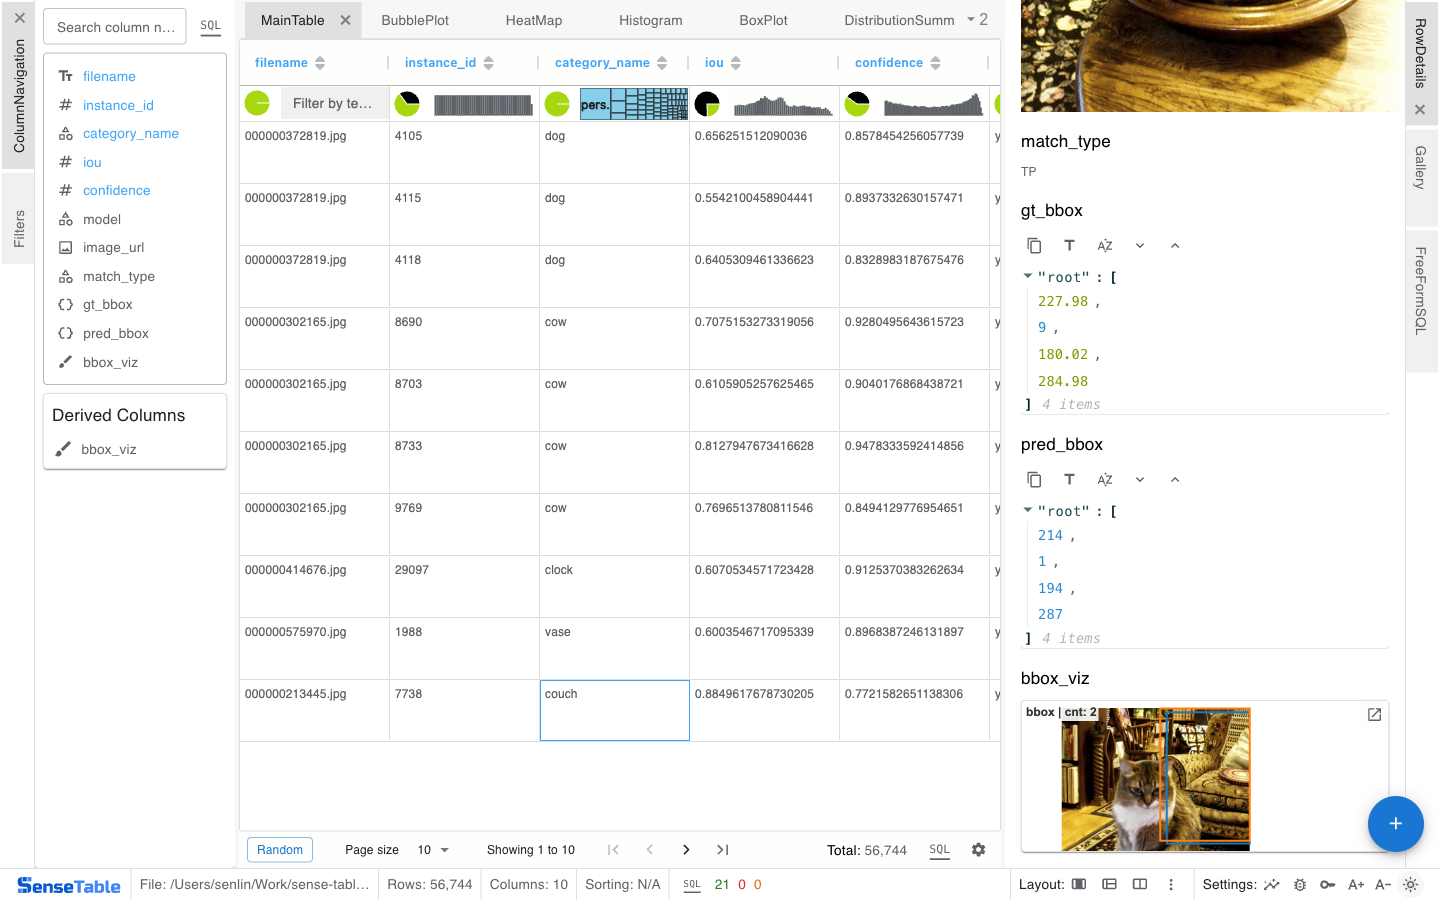
SenseTable translates your GUI interactions into SQL queries, executes them with a high-performance query engine, and returns results as interactive visualizations.
Throwing raw data directly at an LLM is rarely optimal. SenseTable gives the LLM accurate, efficient context automatically, and intepret its response into intuitive GUI.